Developer Guide
Below is a guide to key elements of reportscript. This guide will help you make awesome PDF reports!
The Basics
Reportscript works by turning a Document into a PDF file. Documents are simple data objects that specify what content should go into your report, and reportscript figures out how to render your report into as many pages as needed to display the entire contents of the provided document. Use the renderPdf(…) function to transform a Document into a PDF report:
1
2
3
4
5
6
7
8
9
10
11
12
13
14
15
16
17
18
19
20
21
22
23
24
25
26
const reportDocument = {
  pageNumbers: true,
    headers: {
      style: { fontSize: 18 },
        rows: [{ data: ["My Report"] }]
    },
    layout: "portrait",
    sections: [
      {
        tables: [
          {
            style: { fontSize: 18 },
            rows: createDataRows(),
            headers: [{ data: [{ value: "First Table", columnSpan: 4 }] }]
          },
          {
            style: { fontSize: 18 },
            rows: createDataRows(),
            headers: [{ data: [{ value: "Second Table", columnSpan: 4 }] }]
          },
        ]
      }
    ]
}

renderPdf(reportDocument, outputStream);
The above document produces a report that looks like this:
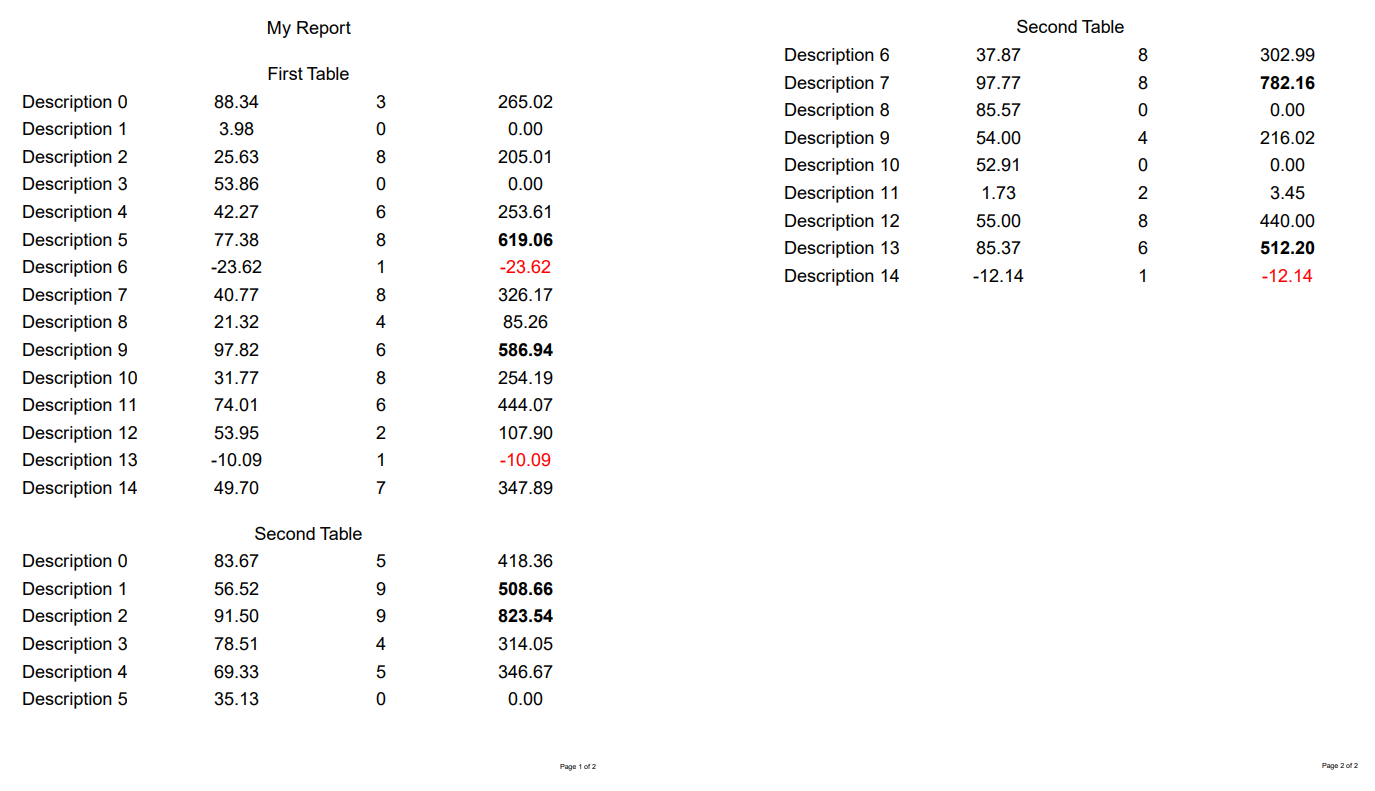
Some key features to note:
- No need to tell reportscript where to break pages
- The second table is automatically split across pages because it doesn’t fit
- The header for the second table is repeated on the next page
- Page numbering works automatically
Where reportscript Runs
Reportscript is supported for both in-browser and server-side usage. The renderPdf(...) function writes the PDF document to a stream, which creates tremendous flexibility. In server-side scenarios, this stream could be an Express response object, a file stream, or a blob stream for storage in a database. In the browser, libraries like blob-stream allow you to write PDFs to HTML5 Blobs and display them entirely in the browser with no server-side code.
Document
A Document is the top-level data object that defines a report. It contains Headers, Footers, Sections and many settings that can be set on the Document level.
Example:
1
2
3
4
5
6
7
8
9
10
11
12
13
14
15
16
17
const document = {
  headers: {
    rows: [{
        data: ["Document Header"],
    }]
  },
  sections: [mySections],
  footers: {
    rows: [{
        data: ["Document Footer"],
    }]
  },
  layout: "portrait",
  timestamp: true,
  pageNumbers: true
}
renderPdf(document)
Documents are oriented around tables. Headers and footers, as well as the contents of sections are all tables. This means that the primary method of document layout is table columns and rows.
Document Headers/Footers
Documents have optional headers and footers. Document headers are displayed at the top of the page. By default, the headers are only displayed on the first page. Document footers are displayed at the bottom of every page. It contains rows, columns, and style.
1
2
3
4
5
6
7
8
9
10
11
12
13
14
15
16
17
18
19
20
21
22
23
const documentHeaders = {
  rows: [{
    data: ["Document Header"],
  }]
  columns: [{align:"left"}]
  style:{
    bold:true
  }
}
const documentFooters = {
  rows: [{
    data: ["Document Footer"],
  }]
  columns: [{align:"right"}]
  style:{
    bold:true
  }
}
const document = {
  headers: documentHeaders,
  sections: [mySections],
  footers: documentFooters,
}
Document Settings
Layout
Layout determines the orientation of the pdf document. The available options are “landscape” and “portrait”. The default is “landscape”.
1
2
3
4
const document = {
  ...myDocument,
  layout: "portrait"
}
Repeat Document Headers
The Document’s headers is displayed at the beginning of the document once by default. This settings will display the Document’s headers on every page.
1
2
3
4
5
const document = {
  ...myDocument,
  headers:[myheader]
  repeatReportHeaders: true
}
Repeat Section Headers
The Section headers is displayed at the start of each section by default. In the scenario where a section takes up 2 more pages, this setting allows repeating of section headers at the start of every page.
1
2
3
4
5
const document = {
  ...myDocument,
  sections:[section1,section2]
  repeatSectionHeaders: true
}
Page Number
Display page numbers on the bottom right of every page. Example: “Page 1 of 10”
1
2
3
4
const document = {
  ...myDocument,
  pageNumbers: true
}
Timestamp
Display timestamp on the bottom right of every page. Example: “Wed Apr 05 2023 04:05:58”
1
2
3
4
const document = {
  ...myDocument,
  timestamp: true
}
When coupled with Page Numbers, the timestamp will be displayed first. Example: “Wed Apr 05 2023 04:05:58 Page 1 of 10”
Section Page Number
Since a Document can have many Sections, this setting gives us the option to allow each section to have their own page numbers. Page numbers reset to 1 for every section. An error will be thrown if both pageNumbers and sectionPageNumbers are set to true.
1
2
3
4
5
const document = {
  ...myDocument,
  sections: [section1, section2]
  sectionPageNumbers: true
}
timeStampPageNumberFontSetting
timeStampPageNumberFontSetting change the default font settings for any page numbers and timestamps. See available font settings.
1
2
3
4
5
6
7
8
9
const document = {
  ...myDocument,
  tinmestamp: true,
  pageNumbers: true
  timeStampPageNumberFontSetting: {
    bold: true,
    underline: true
  }
}
Watermark
Displays a watermark on every page of the pdf. If a section has Watermark set, it will override the document watermark setting.
1
2
3
4
5
6
7
8
const document = {
  ...myDocument,
  watermark: {
    text: "Don't steal :)",
    fontFace: "Times-Bold",
    color: "ff0000"
  }
}
Page Break Rows
Page Break Rows allow you to specify what should be displayed when there is more than one page to the document.
1
2
3
4
5
6
7
8
9
10
11
12
const document = {
  ...myDocument,
  pageBreakRows: {
    rows: [{
      data: [{ value: "(continued on next page)", align: "left" }]
    }],
    columns: [{ width: "2fr" }]
    style: {
        bold: true
    }
  }
}
Table Gaps
Sets the vertical spacing between tables in the document. Default value is 18 points (see measurement). Any section tableGap settings will override the document tableGap.
1
2
3
4
const document = {
  ...myDocument,
  tableGap: 5
}
Section
A document can have many sections. Each Section can span multiple pages, and a new section will always start on a new page. Section Headers are similar to Document Headers and Footers. Much like documents, sections have headers that can be configured to repeat on subsequent pages. Sections contain Tables.
Sections can override the document-level TableGap and Watermark settings.
1
2
3
4
5
6
7
8
9
10
11
12
13
14
15
16
17
18
19
const section = {
  headers: {
    rows: [{
      data: ["My Section Header"],
  }]
    columns: [{ align: "left" }]
  },
  tables: [sectionTables],
  tableGap: 12
  watermark: {
    text: "Section Watermark",
    fontFace: "Times-Bold",
    color: "ff0000"
  }
}
const document = {
  sections: [mySection],
}
renderPdf(document)
Table
Sections must have at least one Table. Tables have Headers, Rows, Styles (for row style options), and Columns. The style that is set here will be applied every row in the table, unless you choose to override them at the row level (discussed later).
1
2
3
4
5
6
7
8
9
10
11
12
13
14
15
16
17
const table = {
  headers: [{
    data: ["Label","Quantity","Rate","Total"],
    options: { bold: true },
  }],
  rows: [...dataRows],
  columns: [
   { width: "2fr" },
   { width: "1fr" },
   { width: "1fr" },
   { width: "1fr" },
  ],
  style: { grid: true }
}
const section = {
  tables:[table]
}
Table Header
Table Headers are rows that are displayed at the beginning of the table, as well as on each subsequent page when the table spans multiple pages. Their style, and column settings are set by the table.
1
2
3
4
5
6
7
const tableHeader = {
    data: ["Label","Quantity","Rate","Total"],
  }
const table = {
  headers: [tableHeader],
  rows: [...dataRows],
}
Column Settings
Column Settings specify the orientation of the data within the columns, as well as the width of the columns. By default, all columns in a row have equal widths, and content is centered horizontally.
1
2
3
4
5
6
7
8
9
10
11
12
13
14
15
const table = {
  headers: [{
    data: ["Label","Quantity","Rate","Total"],
  }],
  rows: [...dataRows],
  columns: [
   { width: "2fr", align: "left" },
   { width: "1fr", align: "right" },
   { width: "1fr" },
   { width: "1fr" },
  ],
}
const section = {
  tables:[table]
}
Align
Set horizontal alignment for the contents in each column. Default is “center” .The available orientations are “left”, “center”, “right”
1
2
3
4
5
6
7
8
9
10
const columnSetting =  [
   { width: "2fr", align: "left" },
   { width: "1fr", align: "right" },
   { width: "1fr" },
   { width: "1fr" },
  ],
const table = {
  ...myTable,
  columns: columnSetting
}
Width
Set the width of the column. Currently, reportscript supports fractional unit (fr), percentage (%), points (pt).
- Units:
- Fractional unit:
- Sets column widths as fractional parts of the available row width. The available row width is the width of the table minus the width of columns specified in points or percentages.
1
2
3
4
5
6
7
8
9
10
11
12
13
// Column 2 will be twice the width of column 1, and column 3 will be half the width of column 1.
const columnSettings1 = [
  { width: "1fr" },
  { width: "2fr" },
  { width: "0.5fr" },
]

// All columns are equal width. This is the default width setting.
const columnSettings2 = [
  { width: "1fr" },
  { width: "1fr" },
  { width: "1fr" },
]
Percentage:
- Sets column widths as percentage of the available row width. If the total sum of all column percentage exceeds 100%, it will throw an error.
1
2
3
4
5
6
7
8
9
10
11
12
13
// Valid column settings with percentage units.
const columnSettings1 = [
  { width: "50%" },
  { width: "25%" },
  { width: "25%" },
]

// Invalid percentage column settings. Will throw an error.
const columnSettings2 = [
  { width: "50%" },
  { width: "25%" },
  { width: "30%" },
]
- Point:
- Sets the column width as points (1/72 of an inch). An error will be thrown if the total points exceeds the available page width.
1
2
3
4
5
6
7
8
9
10
11
12
13
14
15
16
17
18
19
20
// Valid point unit usage for columns in landscape layout (available width = 756).
const columnSettings1 = [
  { width: "300pt" },
  { width: "300pt" },
  { width: "156pt" },
]

// Valid point unit usage for columns in portrait layout (available width = 576).
const columnSettings2 = [
  { width: "300pt" },
  { width: "200pt" },
  { width: "76pt" },
]

// Invalid point unit usage (landscape layout). Will throw an error.
const columnSettings3 = [
  { width: "300pt" },
  { width: "300pt" },
  { width: "180pt" },
]
Combining units:
1
2
3
4
5
6
7
8
9
10
11
12
13
14
15
16
17
18
19
20
21
22
23
24
25
// Valid combinations (available width = 756).
const columnSettings1 = [
  { width: "50%" },
  { width: "1fr" },
  { width: "350pt" },
]

const columnSettings2 = [
  { width: "1fr" },
  { width: "2fr" },
  { width: "250pt" },
]

// Invalid combinations (available width = 756).
const columnSettings3 = [
  { width: "50%" },
  { width: "50%" },
  { width: "1fr" },
]

const columnSettings4 = [
  { width: "50%" },
  { width: "25%" },
  { width: "200pt" },
]
- Fractional unit:
ColumnSplitFns
In some cases, it may be beneficial to allow reportscript to split a row such that portions of it display at the bottom of a page and at the top of the next page. You can import splitColumn to accomplish this, or use your own custom split function. The splitColumn function inserts ‘(continued on next page)’ and ‘(continued from previous page)’ into the rows before and after the page break, respectively.
1
2
3
4
5
6
7
import { splitColumn } from "report-script";

const columnSettings = [
  { width: "1fr" },
  { width: "2fr", splitFn: splitColumn, align: "left" },
  { width: "1fr" },
]
Row
Row contains data for an entry in a table. It has options which override any table-level settings.
1
2
3
4
5
6
const row = {
    data: ["Label","Quantity","Rate","Total"],
  }
const table = {
  rows: [row],
}
Data
Data is an array of CellValue or Cell. Cell Value could be any strings or numbers. Cell is an object that is used when you want to specify certain setting for a cell. You can have a mix of Cell and CellValue when specify your data.
1
2
3
4
5
6
7
8
9
10
11
12
13
14
15
const row = {
    data: [
      "John",
      29,
      {
        value: "On PTO",
        color: red
      },
      "IT Manager"
    ],
  }
const table = {
  rows: [row],
}
Image
Adds an image for the entire row with no other data.
1
2
3
4
5
6
7
const row = {
  image: {
    image: fs.readFileSync("./my-image.png"),
    height: 50,
    width: 50
    },
  }
Cell
As discussed in Data, you can specify certain settings for a cell. Cell is another way you can embed an image in your document. Unlike Table, and Row, the settings is a part of the cell rather than a separate style or option property.
1
2
3
4
5
6
7
8
9
10
11
12
const imageBuffer = fs.readFileSync("./John-image.png");

const imageCell = {
  image: { image: imageBuffer, height: 35, width: 150 },
  align: "center",
  columnSpan: 3
}
const textCell = {
  value: "John",
  align: "left",
  backgroundColor: "#e6e6e6"
}
Text Cell
A text cell includes data as a string or number, as well as optional styles. These settings will override the Row Settings for this specific cell
1
2
3
4
5
6
7
const imageBuffer = fs.readFileSync("./John-image.png");

const textCell = {
  value: "John",
  align: "left",
  backgroundColor: "#e6e6e6"
}
Image Cell
An Image can be added to a row cell with optional styles. Height, image, and width is required to specify. If the measurements exceed the available space, it will throw an error. This allows you to have pictures and other data within the same row.
1
2
3
4
5
6
7
const imageBuffer = fs.readFileSync("./John-image.png");

const imageCell = {
  image: { image: imageBuffer, height: 35, width: 150 },
  align: "center",
  columnSpan: 3
}
Style/Options
You can set certain settings at Table, Row and Cell level. They do look a little different on each level. Not all settings are available through all 3 levels.
1
2
3
4
5
6
7
8
9
10
11
12
13
14
15
16
const cell = {
  value: "I am yello",
  backgroundColor: "yellow"
}
const row = {
  data : ["we are yellow"],
  options:{
    backgroundColor: "yellow"
  }
}
const table = {
  rows: [...dataRows],
  style: {
    backgroundColor: "yellow"
  }
}
| Table | Row | TextCell | ImageCell | |
|---|---|---|---|---|
| backgroundColor | ✓ | ✓ | ✓ | ✓ |
| bottomBorder | ✓ | ✓ | ✓ | ✓ |
| grid | ✓ | ✓ | ✓ | ✓ |
| gridColor | ✓ | ✓ | ✓ | ✓ |
| lineGap | ✓ | ✓ | ✓ | ✓ |
| noWrap | ✓ | ✓ | ✓ | ✓ |
| verticalAlign | ✓ | ✓ | ✓ | ✓ |
| bold | ✓ | ✓ | ✓ | ✗ |
| boldFace | ✓ | ✓ | ✓ | ✗ |
| color | ✓ | ✓ | ✓ | ✗ |
| fontFace | ✓ | ✓ | ✓ | ✗ |
| underline | ✓ | ✓ | ✓ | ✗ |
| border | ✓ | ✓ | ✗ | ✗ |
| align | ✗ | ✗ | ✓ | ✓ |
| columnSpan | ✗ | ✗ | ✓ | ✓ |
backgroundColor
String - Set background color (example: “yellow” or “#e6e6e6”).
bottomBorder
Boolean - Adds a bottom border to the cell, or row.
grid
Boolean - Adds a border around the cell.
gridColor
String - Sets the color of the grid borders. Default is black.
lineGap
Number - Sets the line spacing around the cell contents. Default value is 4.5.
noWrap
Boolean - Prevents a text from wrapping within a cell. If true, adds an ellipsis (“…”) at the end of the text if cutoff.
verticalAlign
String - Sets the vertical alignment of a cell’s contents within the table row. Default is “center”. Available options are "top" "center" "bottom".
bold
Boolean - Bold text.
boldFace
String - Font when text is bold. Default value is “Helvetica-Bold”.
color
String - Font color. Default value is black.
fontFace
String - Font setting. Default is “Helvetica”.
fontSize
Number - Font size. Default is 7.
underline
Boolean - Underline text.
border
Boolean - Border around the table if set at Table level, and around row if set at Row level.
align
Number - Sets the horizontal alignment of the contents within a cell. Default is “center”. Available options: "left" "center" "right".
columnSpan
Number - Sets how many columns within a row a cell will span. Default is 1.
Default Document Measurements
Documents are rendered as standard 8.5in x 11in page size (or 612pt x 792pt where 1 pt = 1/72 of an inch). Some default values for the document include the following:
- tableGap: 18
- lineGap: 4.5
page margin: 18 The available page widths for tables are as follows:
- landscape layout: 756 (792 - 2 * page margin)
- portrait layout: 576 (612 - 2 * page margin)
renderPdf
Write to Express HTTP response:
1
2
3
4
5
6
router.get("/" (req, res) => {
  const document = createDocument(req);
  renderPdf(document, res);
})

function createDocument(req: Request): Document {...}
Write to file path:
1
2
const path = path.join("cool_name.pdf");
renderPdf(document,fs.createWriteStream(path))
Write to browser
To write to browers you will need to use Browserify or webpack. You can use a Blob object, which can be used to store binary data, and get URLs to this data in order to display PDF output inside an iframe, or upload to a server, etc. In order to get a Blob from the output of PDFKit, you can use the blob-stream module.
Note, if you use Browserify, you will need to install brfs module with npm. Browserify will throw error if not installed.
1
2
3
4
5
6
7
8
import blobStream from "blob-stream";

const blob = blobStream();
const stream = renderPdf(document, blob);
stream.on("finish", function () {
  const url = stream.toBlobURL("application/pdf");
  iframe.src = url;
});